Order flow made simple.

Order flow and GEX levels on GC, ES and NQ.

GC ES NQ ORDER FLOW · GEX LEVELS
What it shows

Order flow data and GEX levels.
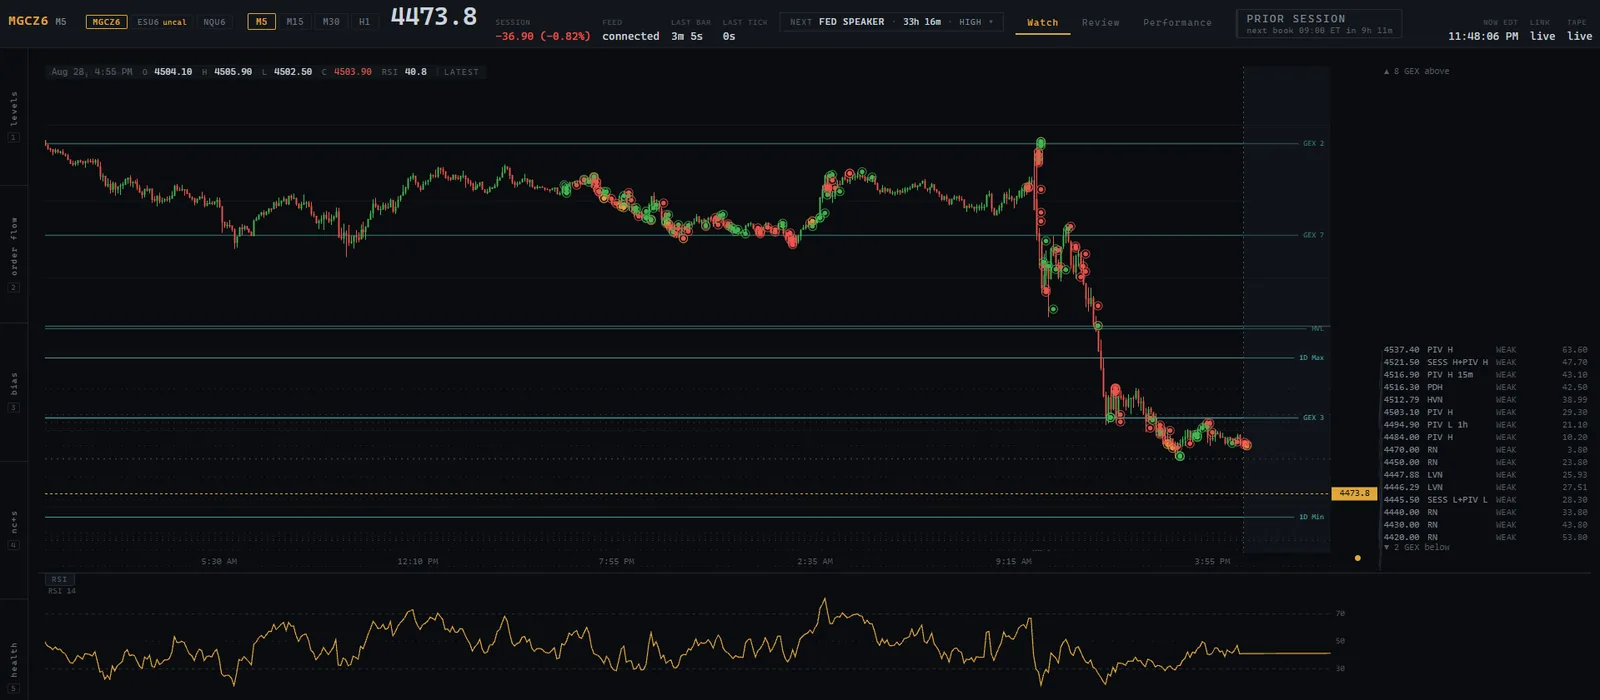
GCESNQ
wristjer dashboard: GC candles with level ladder, GEX levels and order flow detections
What you get

Three things, live all session.

/01
Live GEX levels

Updated every hour, straight from the options book, during the New York session.

/02
Live order flow

Read off the tape in real time and simplified onto the chart.

/03
Moving pivot levels

With LVN, POC and HVN marked as they shift through the session, and each level rated strong or weak.

A session

Set before the open, live until the close.

PRE-OPEN
Levels are set

GEX levels carried in from the previous session, pivots drawn before the bell.

SESSION
Order flow runs live

The tape is read as it prints and simplified onto the chart, hour by hour.

CLOSE
Levels reset

Pivots and value areas are redrawn from the session that just finished.

Track record

Funded accounts, paid out.
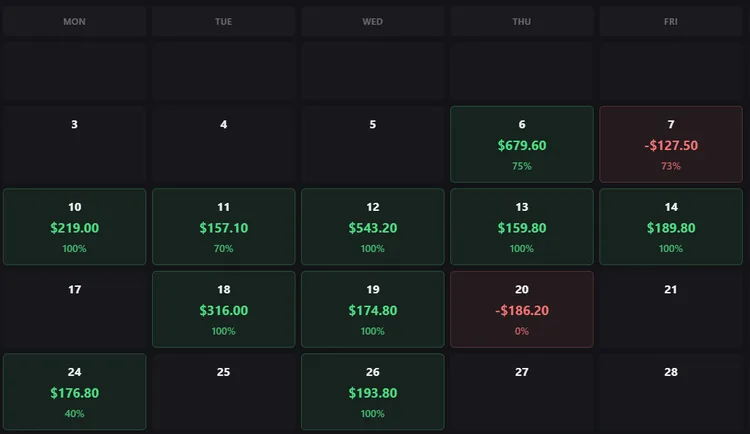
Daily profit and loss by session on a funded account
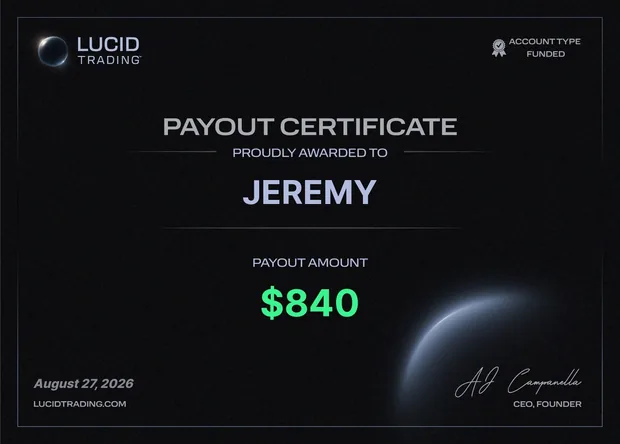
Payout certificate for $840 from Lucid Trading, dated 27 August 2026
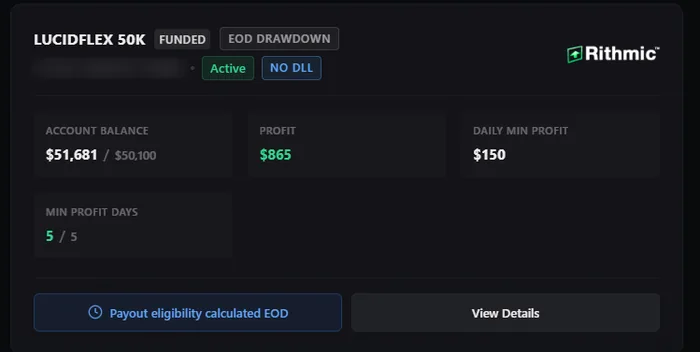
LucidFlex 50K funded account showing a $51,681 balance, $865 profit and five of five minimum profit days
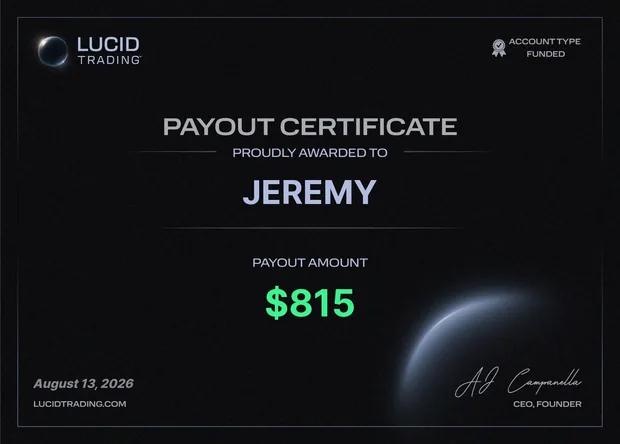
Payout certificate for $815 from Lucid Trading, dated 13 August 2026

Screenshots from the developer’s own funded accounts. A record of past sessions, not a projection — individual results vary, and nothing here claims the dashboard produces profits.

Access

One plan. Pay monthly or commit.

SINGLE TIER LAUNCH PRICING BETA
$150 $97 / month
SAVE $53 A MONTH · 35% OFF
$450 $261 / 3 months
$87 PER MONTH · 42% OFF
$900 $485 / 6 months
$81 PER MONTH · 46% OFF
IN BETA

The dashboard runs live every session, but features are still changing and you should expect occasional downtime.

All three instruments, one seat 7-day trial on any term Payment and access via Whop
Included
Live GEX levels, refreshed hourly through the New York session Live order flow, read off the tape and drawn on the chart Moving pivot levels, with LVN, POC and HVN, rated strong or weak

GC, ES and NQ, all session. Nothing to configure.

On the chart

What it looks like as price reaches a level.
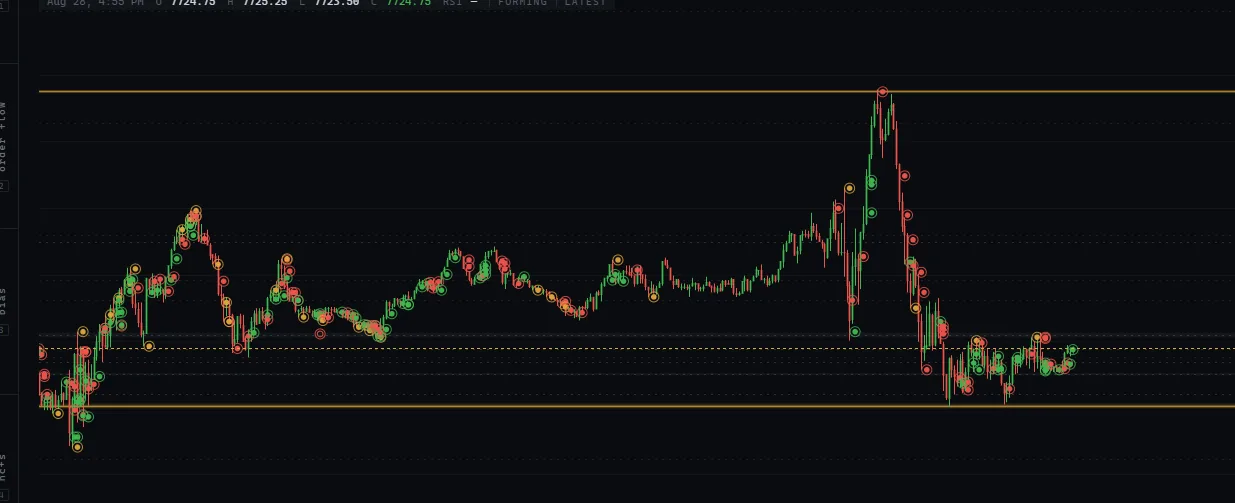
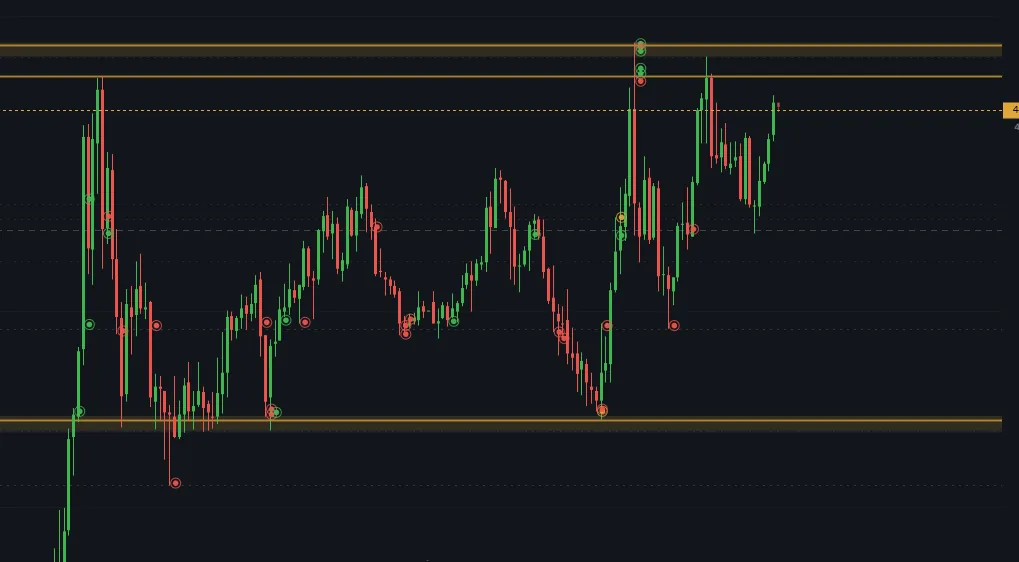
Order flow detections printing across a full session between two levels
A full session, between two pivot levels GC · 5M

The pivots are not fixed. They shift through the session as volume builds, so the band moves with price.

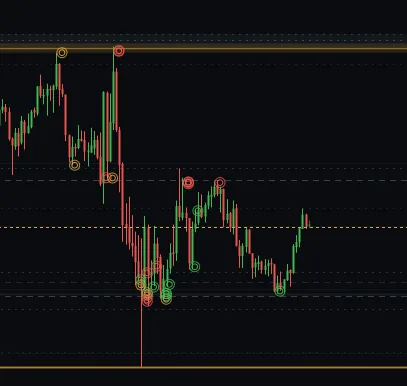
Detections stacking under a level as price approaches it
Approaching the level

Prints stack as price works into the band, and again on the push through it.

Detections clustering at a level on a closer timeframe
Up close

The same cluster, zoomed in. Where the tape turned, marked as it happened.

FAQ

Questions worth asking.

What is it, in one sentence? +

A live dashboard that puts order flow data, GEX levels and moving pivot levels on one chart for GC, ES and NQ.

Is this a signal service? +

No. There are no entries, exits, targets or calls. It shows what is happening on the tape and where the levels sit. The decision stays yours.

Which instruments does it cover? +

Gold futures (GC), the S&P (ES) and the Nasdaq (NQ). One screen each, live through the session.

What does access cost? +

$97 a month, with cheaper rates on 3 and 6 month terms. One plan, same access whichever you pick, and a 7-day trial. Payment and access are handled through Whop.

How do I cancel? +

Inside Whop, any time. Access ends at the close of the billing period.

Where does the data come from? +

Exchange order flow, at tick level. Nothing is estimated from bar volume.

How often do the GEX levels update? +

Every hour through the New York session, so the levels you are looking at reflect the current book rather than yesterday’s.

What are the pivot levels? +

Levels that move with the session, marked with LVN, POC and HVN so you can see where volume thinned out and where it built.

Do I need my own data feed or platform? +

No. It runs in the browser and the data comes with access. Nothing to install, connect or configure.

Does it work on mobile? +

It loads on a phone, but it is built to be read on a desktop screen. The charts are dense by design.

Is it for beginners? +

It assumes you already know how you trade. If order flow and gamma levels are new to you, this will show them clearly. It will not teach you a strategy.

Is there a track record? +

No, and none is claimed. It is a tool for reading the tape, not a service selling results.

Where do I get help? +

The Discord is free and open. Questions about the dashboard get answered there.

Put it on your screen tomorrow morning.

Free for seven days. If it does not change how you read the session, cancel and keep the Discord.

Instant access · cancel any time